2. Exchange Infrastructure
Now we'll take a look at the second half of this scenario and test out our XI interface.
2.1 Check Configuration
The only configuration we are going to check is the outbound communication channel. This is what tells Exchange Infrastructure where to pick up what file (location, filename) and do what after it's processed by the inbound communication channel (processing mode, ie: delete).
· Start your Integration Directory (Integration Builder: Configuration).
· Navigate to your outbound communication channel.
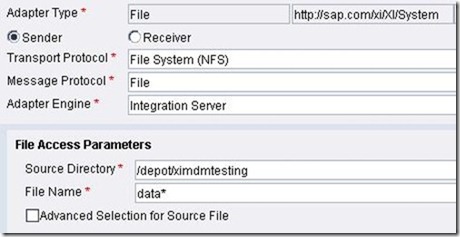
· Examine your File Access Parameters.
In my case, because this is a test scenario, I have a bash script picking up the file from the port directory and dropping it onto a drive that all of the SAP systems have access to; this being the /depot filesystem. As you can see I made a temporary folder on that filesystem for the files for this interface to be stored while waiting to be processed. Of course, the simplest way to do this would be to mount the Port directory from your MDM machine to your XI machine. Next take a look at your Processing Parameters and change the settings accordingly. For this particular scenario I have set the poll interval to 5 seconds for testing purposes. Also, notice that I am using delete as the processing parameter. This is so that I can verify that the file was processed, and so the folder doesn't get cluttered up with files. 
If everything is the way you want it, lets go ahead and take a look at some important locations that will come in handy for testing and debugging the interface.
2.2 Important Locations
2.2.1 Integration Repository - Map Testing
Start the Integration Repository (Integration Builder: Design) and navigate to the map that we built in Part II. Select the Test tab. 
To test our map, we can actually use the XML document that MDM generated via the Syndication Server. Lets go ahead and try this.
· Press the "Load Test Instance" button.
· Select the XML file MDM generated.
· Press the "Start Transformation" button.
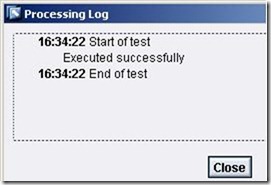
If everything went smooth then you should see a pop up screen that says "Executed successfully". Otherwise you will recieve an error to which you can begin your debugging process.
2.2.2 Runtime Workbench - Component Monitoring
The runtime workbench is one of the most powerful and useful features of Exchange Infrastructure. Here we can get very detailed descriptions of errors that may occur with each component of XI. The component that we will want to pay particular attention to is the Adapter Engine.
· Log into your runtime workbench and select Component Monitoring -> Display.
· Click the Adapter Engine link.
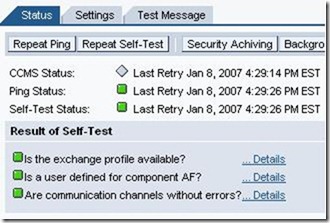
Here you can view the status of the adapter. If there is an error in your configuration of a particular adapter it will show up here.
2.2.3 Runtime Workbench - Message Monitoring
Follow a similar procedure to display that Message Monitoring.
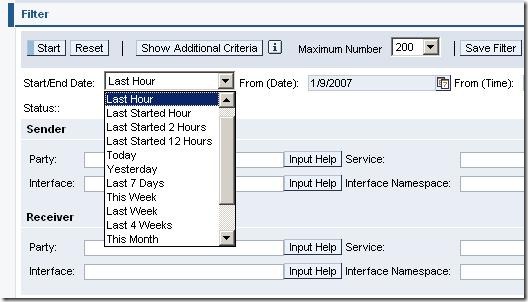
· Select your time filter, in this case I will select the last hour.
· Press Start.
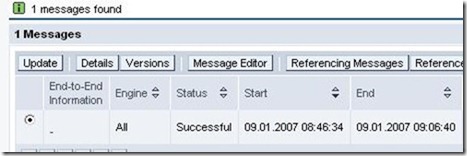
You can now see the list of messages that have been processed by the Adapter Engine over the last hour. On my system only one message has been processed in the last hour. You can press either Details or Versions to view more information about any particular message that was processed.
2.2.4 Integration Engine - Monitoring
This is a particularly useful component of Exchange Infrastructure that allows us to view various aspects of the messages that get processed. Lets start by logging into the XI system and taking a look.
· Run transaction SXMB_MONI.
· Double-click Monitor for Processed XML Messages.
· Press F8 or the Execute button.
